Last week, we published our second Year In Review benchmark report. The goal of that effort was the same as our goals for everything we do — to help senior living operators drive sales and marketing excellence.
Today, we're sharing 8 Key Takeaways from the "All Industry" data to help you power a better 2024 for your communities, company, team, and career.
Download the full report to gain valuable insights to power a better 2024.
1. Occupancy
After a rebound year for occupancy in 2022, 2023 started the year flat, with occupancy increases in the back half of the year.

2. Care type comparison
Most communities across care types had modest gains over the year, with blended communities outperforming their single care type AL and MC competition.

3. Leads
Monthly average new inquiries grew ~6% vs. prior year, driven by persistently high leads in the first half of the year. Lead volume dropped in Q4, in line with pre-COVID seasonality.
This influx of leads is driven by the digitally enabled baby boomers and their families, who are approaching the senior living buying journey in a new way — online. They are doing more research, considering and comparing more communities, and, as a result, can be difficult to win.

4. Initial tours
Despite a ~6% uptick in average monthly new leads relative to 2022, tour volume has been relatively flat vs. last year.
But prospects still want to move quickly to assess their options: 50% of prospects tour within 4 days, and nearly all tour within 2 weeks.
For prospects who dwell for more than 30 days post-tour, often a retour is needed. On average, communities complete ~3 retours a months.

5. Move-ins & move-outs
A 9% drop in average monthly move-in volumes drove sluggish occupancy in 2023. Despite flat tour volume, the low volume of move-ins caused the ratio of tours to move-ins to drop 3 percentage points.
But for prospects who do move in, a decision is made quickly post-tour:

and nearly all move in within 60 days. For those who dwell longer, a retour is often required.
6. Conversion
In 2023, we had deflated performance across conversion metrics, but most notable was the drop in tour to move-in (3 percentage point drop in average monthly conversion of tours to move-ins in 2023 vs. 2022).
Dropping conversions hint at several trends:
Communities reaching a tipping point on lead volume: More leads without a defined outreach strategy and process will be challenging to convert
A new buying journey for seniors: As prospects research more communities online and extend their research timeline, they can be harder to win
Broad occupancy landscape improving: In December, >25% of communities were above 92%; when buildings are full, move-ins drop
7. Sales activities
The number of activities required to drive a move-in will depend on the care type and length of sales cycle, but we can use general weekly benchmarks to guide approach.

8. Lead source analysis
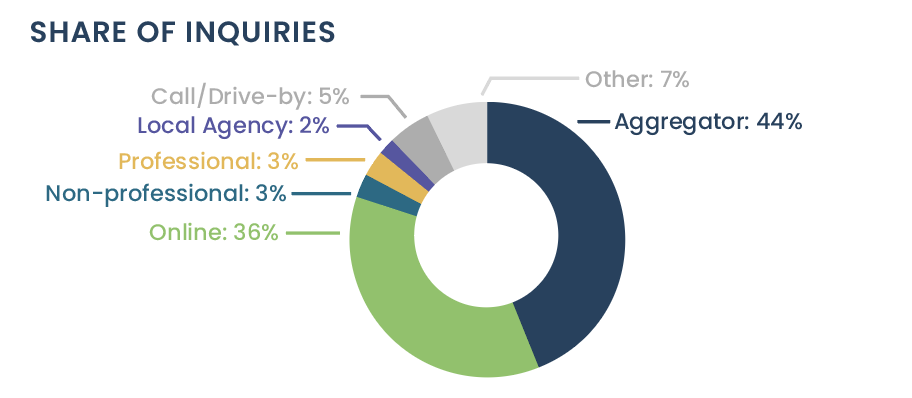
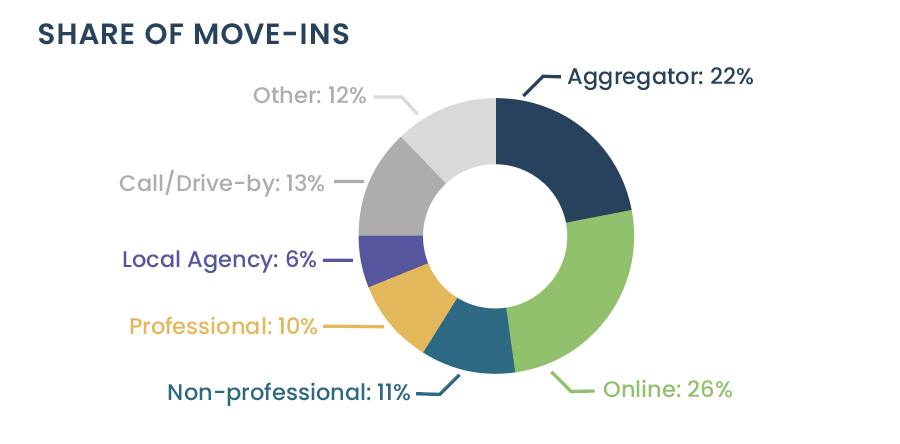
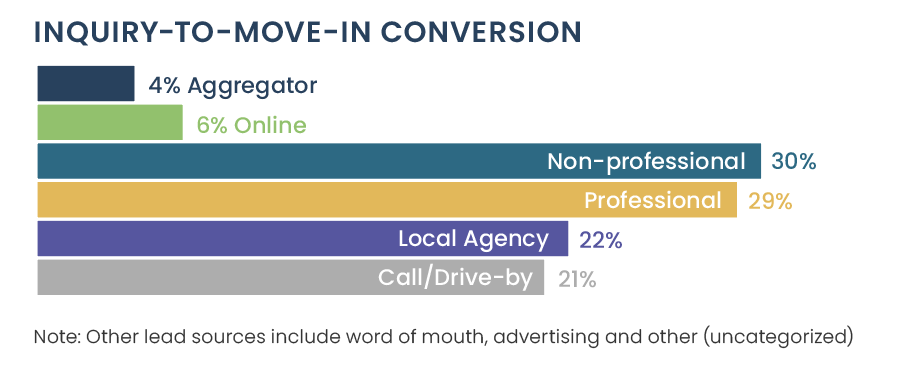
Online and aggregator leads are the highest volume inbound lead sources and at an industry level can make up almost HALF of move-ins. But these leads aren’t easy to win. Prospects inquiring via these channels are doing research and comparing options, and have varying timelines and levels of education on senior living.
Even when these leads do move in, they are quick to move out if a community isn’t meeting their needs. More than 50% of aggregator and online prospects move out in less than a year.
In Conclusion
The Customer Insights team at WelcomeHome is dedicated to delivering the data that matters most to you. All to serve our seniors and customers and to unlock sales and marketing success for you and your teams.
Interested in more valuable insights? Download the full report to learn about the key trends that shaped 2023, the observed traits of the most successful communities, and the valuable information you can use to power a better 2024.


